

Kookaburra Vets Salary Survey 2022
Comments Off on Kookaburra Vets Salary Survey 2022![]() Thank you to all the vets who participated in this year’s Salary Survey. There was a total of 285 respondents, which was disappointing compared to 595 respondents in 2019. We’ve been unable to use some of the information, in particular, location related, as there was insufficient data for a representative sample.
Thank you to all the vets who participated in this year’s Salary Survey. There was a total of 285 respondents, which was disappointing compared to 595 respondents in 2019. We’ve been unable to use some of the information, in particular, location related, as there was insufficient data for a representative sample.
Minimum pay rates and conditions are set in the Animal Care and Veterinary Services Award 2020, which you can find using Google, or at https://awardviewer.fwo.gov.au/award/show/ma000118
You can download a printable pdf version of this report here Kookaburra Salary Survey 2022
Methodology
The pool of vets was contacted by direct emailing the main clinic email for all the clinics in Australia in the Kookaburra database & the vets currently registered as job seekers with Kookaburra (2.000 total), and by including advertising banners with a direct link to the survey on the Australian pages of the websites www.kookaburravets.com and www.vetsuppliersdirectory.com.au , and on all the correspondence sent out from Kookaburra during the survey period. We also asked the HR departments of the major Australian corporates to assist by distributing the link to the survey to their veterinary associates, however, in contrast to previous years where they have been happy to help, none agreed to participate this year. In addition, it was posted on Facebook on one of the Australian Veterinarian network closed group pages, on the Kookaburra Facebook pages, and on Linkedin. We’d like to thank The Lincoln Institute, who distributed the link to the survey to their members.
The survey was open from June 12th to November 7th 2022. It was hosted on Survey Monkey and analysis of results was carried out in Survey Monkey and using Microsoft Excel Office 365. The survey was anonymous, and no IP data was collected. There was a total of 34 questions.
For a Key to the box and whisker plots used, and a summary list of charts, please see the Key
Summary
Summary and links to Charts and Diagrams
- Key to Box and Whiskers Plot
- Hourly Pay Rates vs Years’ Experience
- Hourly Pay Rates vs self-assessed experience level
- Hourly Pay Rates for different General Practice Types (Small Animal vs Mixed vs Equine) for numbers of years since graduation
- Hourly Pay Rates – comparing all Practice Types
- Annualised pay rate for all full time, part time, and casual respondents
- Actual annual pay rate for all full time, part time, and casual respondents using their actual hours worked per week
- Paid Hours worked per week – comparing full time, part time, and casual
- Paid Hours worked compared to Unpaid hours
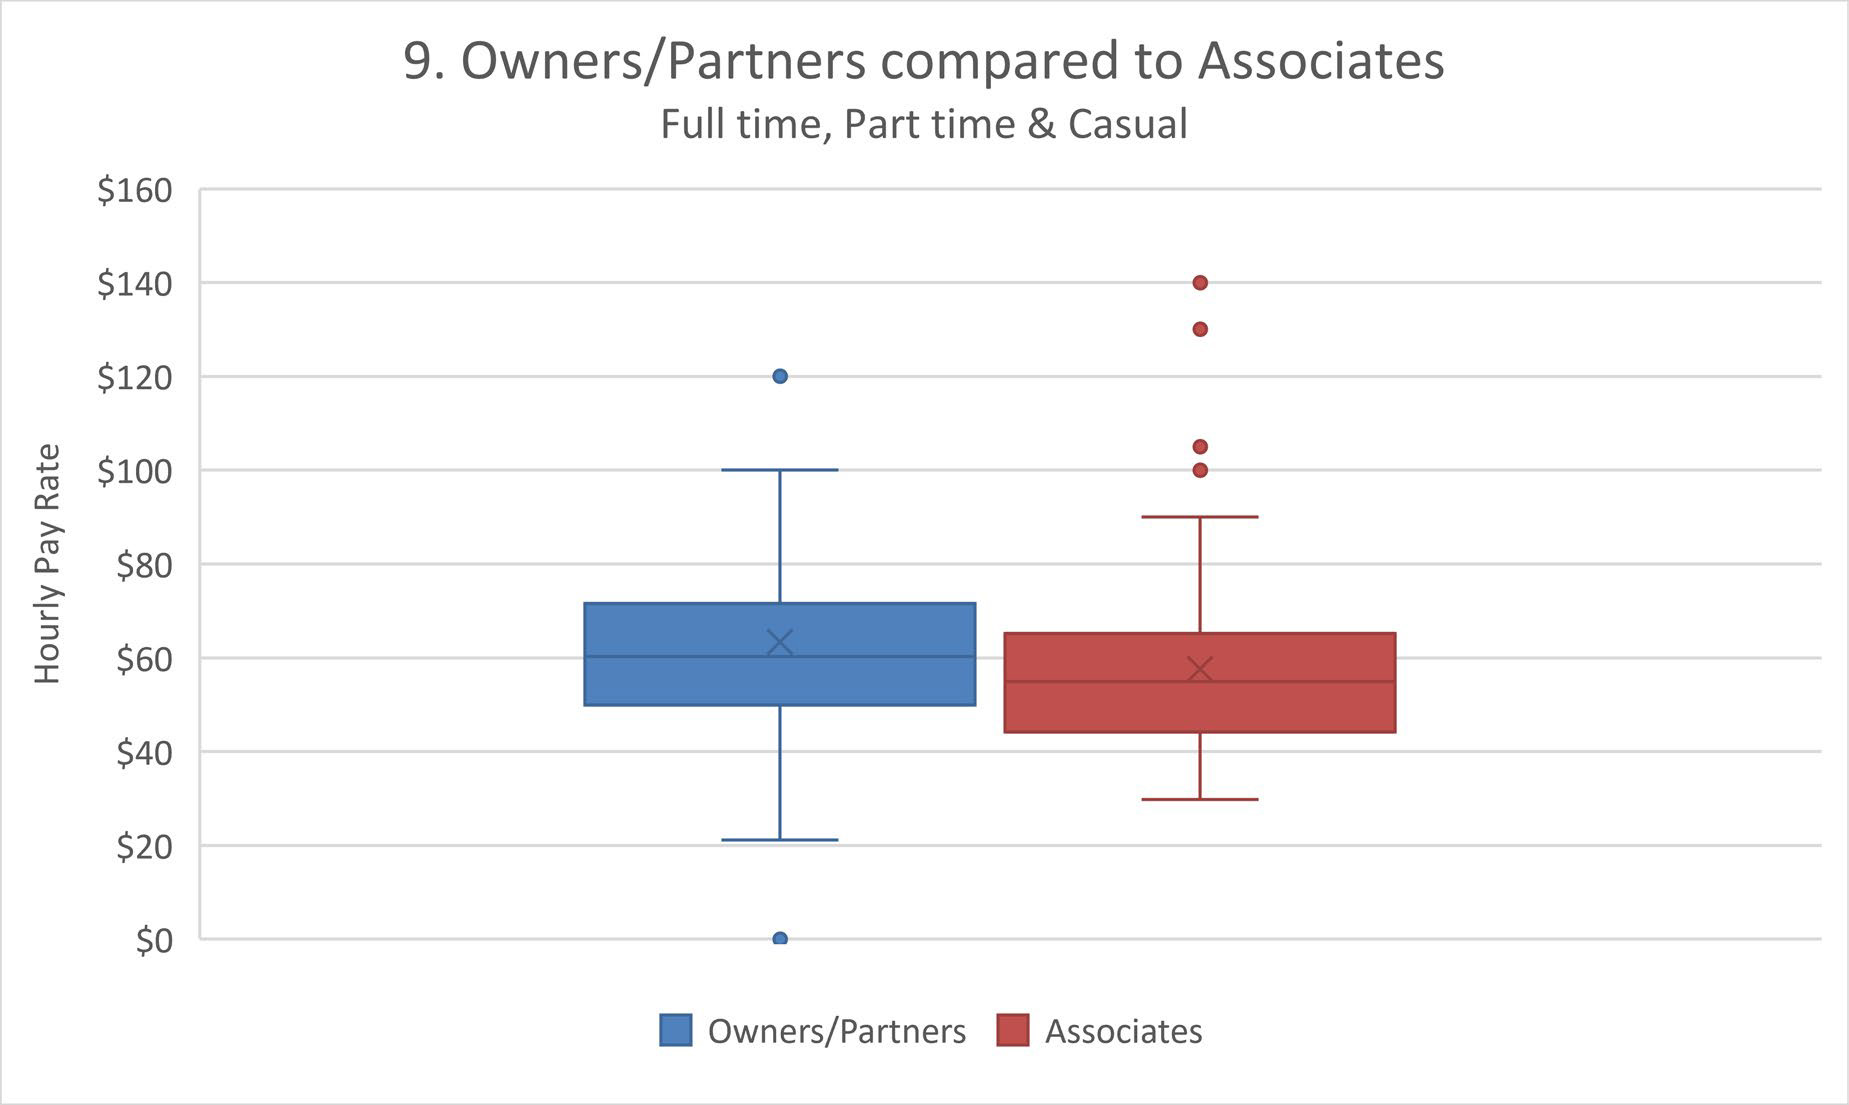
- Owners/Partners compared to Associates pay rate
- Further Qualifications – effect on pay rate
- Further Qualifications – proportions of respondents with additional qualifications
- Locums – hourly pay vs experience
- Locums – casuals vs. locums/short term
- Locums – comparison of corporate & non-corporate pay rates
- Happiness
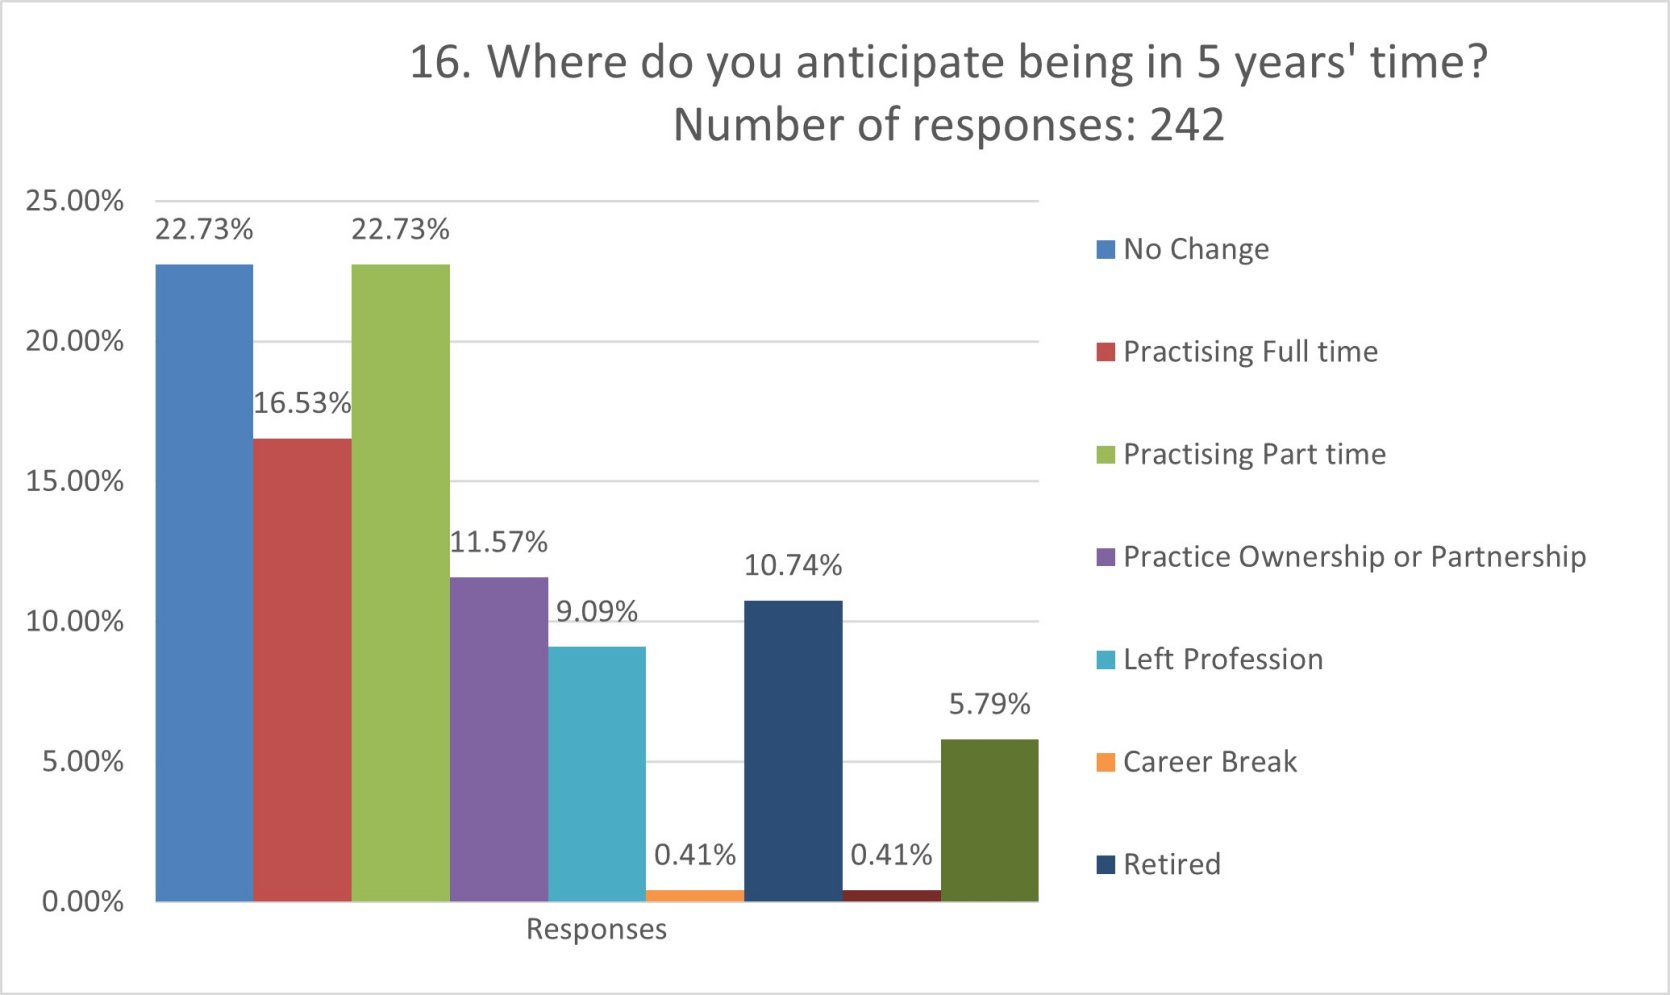
- 5 year Plans
- Happiness and owner/partner vs. associate status
- Happiness and corporate vs. non-corporate jobs
- Satisfaction with pay rates
- Preferred pay rate increase
- Discussion
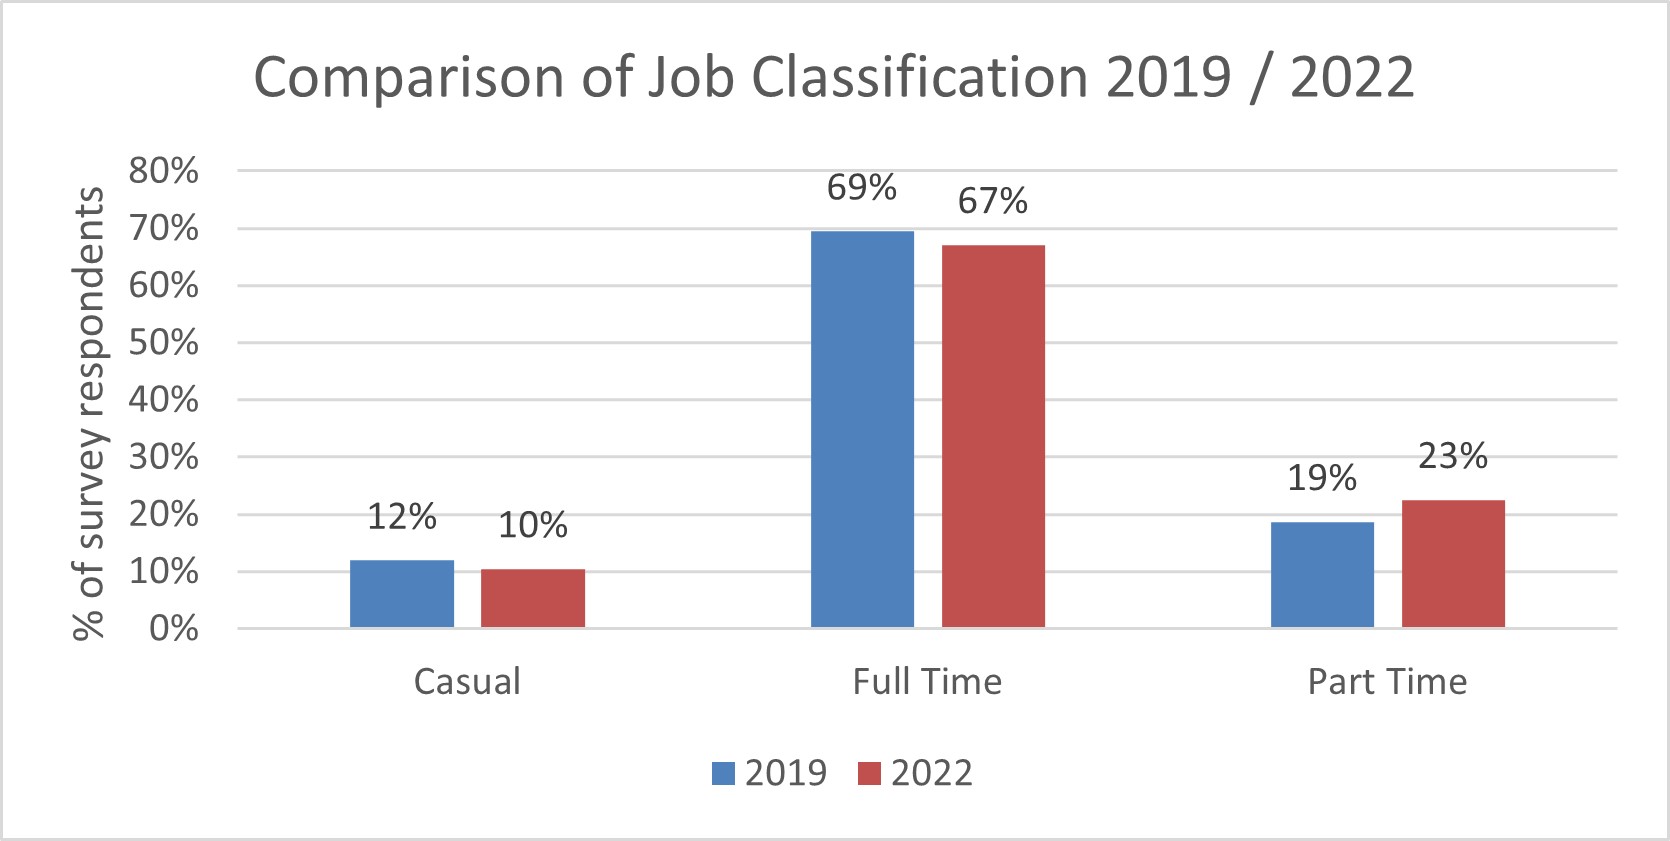
- 2019 / 2022 comparison of job classifcations
- 2019 / 2022 comparison of pay rates
Vets working as Casuals, Part-time, or Full-time
There were a total of 239 responses in this section – some vets gave data for more than one job, and each job was included as a separate data set.


Respondents were asked to self-assess their experience level for the job they were currently answering questions for, on a sliding scale from 1 (Basic Competency) through 5 (Confident and Competent) to 10 (Highly Skilled)


Locums
For data on Locums, we combined the data for jobs classified as Casual with those who answered ‘yes’ to the question “Are you currently working as a locum / doing short term contracts (under 6 months in length)”. There was a total of 51 respondents in these 2 categories.


Happiness and Future Plans


We asked “What do you think you should be paid for this job?” and the choices were “I don’t know”, “My current rate is fair” , or “My preferred hourly rate would be ….” – and the respondent could then nominate an amount (no-one nominated less than they were currently being paid!!)

Discussion
The amount of data collected in this survey was small, therefore it’s hard to discuss the results in a meaningful way. Kookaburra collected the data in order to make it available to vets and their practices in Australia. At Kookaburra, we are interested in the differences between this survey (2022) and our previous one, before COVID, in 2019.
Are more vets moving to working part time and casual?
Have pay rates gone up?
Pay rates have increased by above 30% for locums and casuals, and around 30% for part time and full time vets, between 2019 (pre-COVID) and 2022 (3 years).


© Copyright Kookaburra Veterinary Employment
29th November 2022

 The Register of AVE candidates, and the Return to Work program are 2 useful services provided by the AVA.
 Temporary changes to the Working Holiday Makers Visa conditions may be of benefit to Vets currently working in Australia from overseas – and to their clinics!
 Australia, the UK, and New Zealand all have requirements for registered vets to keep up to date by recording a certain amount of continuing education. New Zealand and the UK have recently changed their focus from simply recording time spent on CE to actually evaluating and reflecting on the learning experience, in order to better support vets in practice, help vets find professional fulfilment, and to aid in retaining vets in the profession.